Introduction to adaptive models monitoring
You can use adaptive models to predict customer behavior by calculating the propensity of customers to accept a proposition, respond to a message, click a web banner, and so on. Because the models are self-learning predictive models, their predictive performance improves with every customer interaction; for example, when a customer accepts an offer, the next version of the model uses that information to provide better predictions.
The propensity values that an adaptive model returns facilitate offer prioritization, which ensures that the next best action is relevant and personalized.
You can monitor the models to check their predictive performance, to obtain insight into how they work and which predictors they use, and to learn how these factors correlate to the outcome.
In Pega Platform™, use Prediction Studio and the standard reports in the Report Browser to better understand adaptive models and monitor their performance.
Prerequisites
Learn how to use adaptive models in decision strategies from the Data Scientist mission on Pega Academy.
Adaptive models monitoring
In Prediction Studio, you can monitor the performance of adaptive models and their predictors to identify poorly performing models, predictors, or propositions. The following example illustrates a chart that shows the correlation between an adaptive model success rate and its performance:
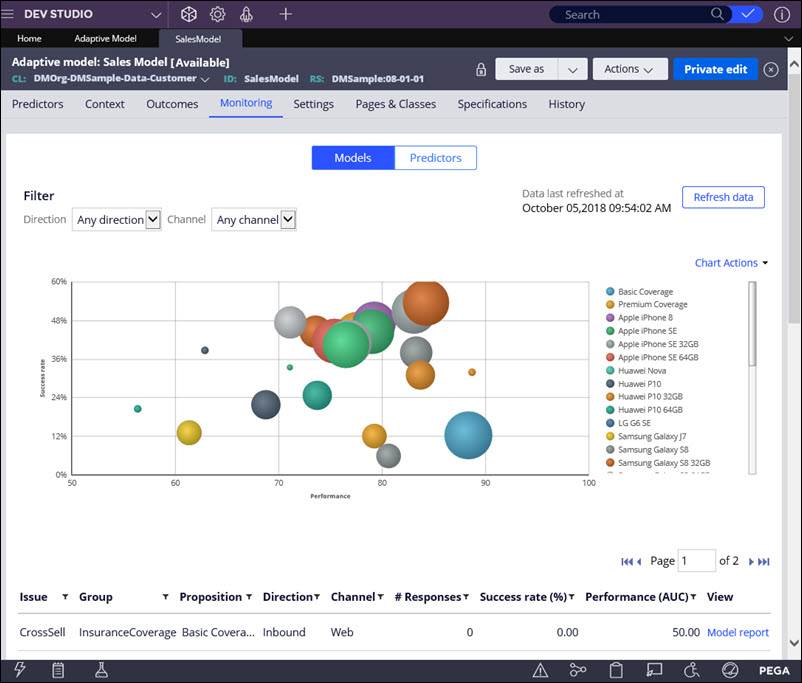
Adaptive model monitoring chart
In the bubble chart, each circle represents one model instance for a specific proposition. The size of a circle represents the number of responses (positive and negative). The axis indicates the accuracy of the outcome prediction. The model performance is expressed in area under the curve (AUC), which has a range between 50 and 100. High AUC means that the model is good at predicting the outcome, while low AUC means that the outcome predictions are not accurate. The axis indicates the number of positive responses divided by the total number of responses (in percentages).
By hovering over a circle, you can view the model performance (AUC), the success rate, and the number of responses.
When to use adaptive models monitoring
Use adaptive models monitoring for the following purposes:
Identify technical problems.
In the Models overview tab, look for adaptive models with a success rate of zero. This means that the propositions for these models do not have any positive responses.
Identify propositions for which the model is not predictive.
In the Models overview tab, look for adaptive models with low performance; these are the models in the left side of the chart. Review the reports for these models and consider adding additional data as predictors.
Identify propositions that have a low number of responses.
In the Models overview tab, look for adaptive models with a low number of responses; these models are represented by the small circles in the chart. Investigate the eligibility criteria in the decision strategy and change exclusion settings to increase the proposition frequency. For more information, see the component categories in Completing the Strategy tab.
Identify propositions that are proposed so often that they dominate other propositions.
In the Models overview tab, look for adaptive models with a high number of responses; these models are represented by the big circles in the chart. A high number of responses might be fine from the business point of view. However, if necessary, you can adjust prioritization in the decision strategy to decrease the proposition frequency. For more information, see Strategy components - Arbitration.
Identify propositions with a low success rate.
In the Models overview tab, look for adaptive models with a low success rate; these are the models that are close to the axis. If the model performance is also low, you can try to offer the proposition to more relevant customers to increase the success rate. If the model performance is already high, the relevance to the customers is high, but the proposition is unattractive and you might want to dismiss it. For more information, see Proposition Management landing page.
Inspect an adaptive model.
Open the Model report to inspect your model after introducing a new proposition, adding or removing a predictor, or changing prioritization in a decision strategy. In the Model report, you can view the active and inactive predictors, investigate the top predictors, or check the uplift among the top-scoring customers. For more information, see Adaptive Model, Proposition Management landing page, and Completing the Strategy tab.
Inspect a predictor.
Check the details of a predictor with a low performance score. A possible cause can be too many missing values for the predictor. Look at the top predictors and in the bins that have a particularly high or low success rate. To inspect a predictor, open the .
Identify predictors that are never used.
In the Predictors tab, look for predictors that are never used by any model. Because unused predictors have only a minor effect on model performance, you do not need to remove them from an adaptive model configuration; however, you can conduct an occasional cleanup as part of your maintenance activities. An unused predictor might still become relevant for a future proposition.
To ensure the accuracy of your adaptive models, perform the following tasks regularly:
- Check the performance of your models every two weeks.
- Check the success rate of your models every two weeks.
- Inspect predictors every two or three months.
Previous topic Importing adaptive models to another environment Next topic Prediction Studio notification types