Tips for troubleshooting data flow rules
From the Data Flow landing page, you can access detailed reports on any errors that occur while a data flow is being processed. By analyzing these the error reports, you can quickly diagnose the root cause of an error.
- Viewing error details
- Viewing the error count per component
- Viewing the error count per node
- Enabling debug logging
Viewing error details
Each error message provides information about the data flow shape in which the error occurred and a link to a stack trace. You can review the method calls in the stack trace to understand the point at which your application encounters an error and which exceptions are raised.
- To view the stack trace, click Details in the error message.

A data flow error message - Optional: To improve the readability of the stack trace, right-click inside the error window, and then click View page source.
Viewing the error count per component
You can view the number of failed records per component in a data flow to detect which shapes are the source of errors.
- On the Data Flow landing page, find the failed data flow, and click on its ID in the ID column.
- Click the Component statistics tab.
- In the #Failed records column, view the number of failed records that is displayed for the data flow component in which the errors occurred.
- View the error list per data flow component by clicking the number of errors in the #Failed records column.

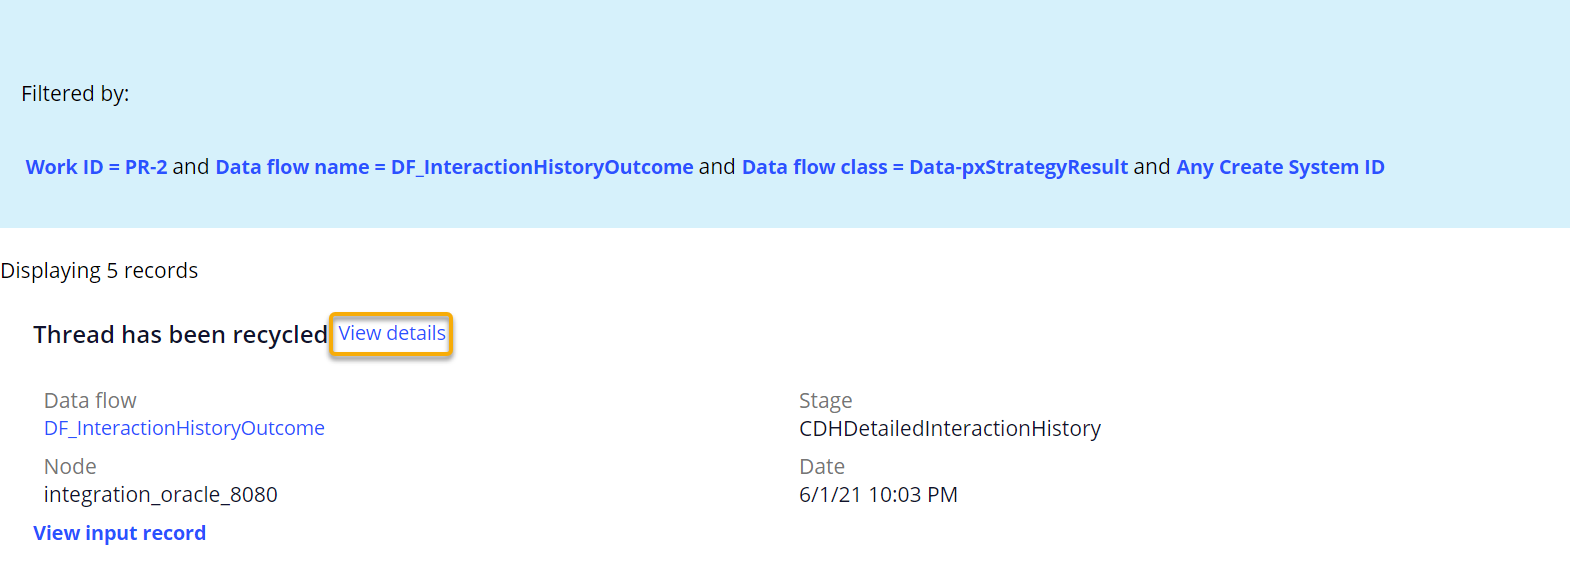
Number of failed records in the Component statistics tab - Click View details to view the stack trace with an error.

View details link - Click View input record to view the record that caused an error.

View input record link
- Click View details to view the stack trace with an error.
Viewing the error count per node
You can view the number of partitions, which are equal segments of data that are spread across distinctive decision data nodes, that a data flow processes. In the case of an error, you can view on which node it occurred. You can also view the throughput per each node, which might give an indication as to which node is the slowest one.
- On the Data Flow landing page, find the failed data flow, and click on its ID in the ID column.
- On the Distribution details tab, view the data flow distribution details.
- View the error list per node:
- In the #Failures column, click the number of errors for the data flow component to view the list of errors.
- Click View details to view the stack trace with an error.
- Click View input record to view the record that caused an error.

Enabling debug logging
When error details do not give you enough information to fix an error, you can enable debug logging for the com.pega.dsm.dnode package to include more output in the generated log files. For example, you can view the SQL query that was running on an external database table when the error occurred.
- In Dev Studio, click Configure > System > Operations > Logs.
- On the Logs tab, click Logging level settings.
- In the Logger name field, press the down arrow key, and then select the name of a class that starts with (or is in the package) com.pega.dsm.dnode.
- In the Current level list, select the logging level. For more information, see Logging level settings tool.

Selecting a logging level for decision management components - Close the Logging level settings window dialog box to save your settings.
Previous topic Tips for troubleshooting Decision Data Store nodes Next topic Troubleshooting an adaptive model with exceedingly high performance
