Monitoring your application using Pega Predictive Diagnostic Cloud
This content applies only to Pega Cloud environments
Pega provides Pega Predictive Diagnostic Cloud (PDC), a performance management service that supports management and development teams by monitoring your Pega application performance and notifying you about system health issues so you can minimize their impact on your business.
Pega PDC is not just a tool for clients; Pega Cloud® Services also uses Pega PDC to monitor stability, throughput and responsiveness for all our client environments, and to help Pega Cloud clients diagnose any reported issues.
For complete details, see Pega Predictive Diagnostic Cloud.
Getting started
Pega Cloud environment provisioning automatically connects your environments to Pega PDC, so you can log on, immediately explore the tool, and set up your notifications. For details, see Getting started with Pega Predictive Diagnostic Cloud.
Pega Cloud clients can access the PDC interface for any environment which your credentials provide access from the My Pega Cloud tab on the My Support Portal.
- Log in to your My Support Portal account.
- Navigate to the My Pega Cloud tab.
- Click the Gear icon next to the environment for which you want to log into PDC.
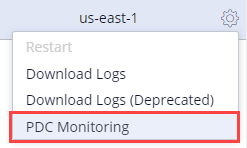
- The link takes you to the PDC login screen for the environment.