Preparing to create and use interactive charts
Summary
Note: This article applies to PRPC version 5+ Summary View reports only. To learn about creating trend reports with the 6.1 SP 2 Report Definition rule, see How to create trend reports.
For PRPC 6.3, see Working with charts in reports (6.3).
Reports are implemented with list view and summary view rules, instances of which the Report wizard generates for you. Starting in Version 5.2, you can use the Interactive Charting feature to display the data from your reports.
Interactive charts provide additional visual effects that are unavailable with static charts. For example, slices of an interactive pie chart separate from the rest of the pie when you click them and the data for the slice appears in a callout. Additionally, interactive charts provide the following new series effects:
- When users change the data range with a slider widget, the slide effect clears the existing data from the report by sliding the data down below the data axis and sliding the new range of data back up into position. You can use this effect for any type of chart, but it’s most effective on line and area charts.
- Zoom widens or contracts the focus on a segment of the data in response to the position of the slider. Use this effect on any kind of chart except pie.
- Interpolation inserts logically projected data points between the reported data points, creating the visual effect of data that flows horizontally across the range of data in response to the slider. Use this effect on pie, line, and area charts.
This article describes how to set up and then access the interactive charts feature. Additional articles describe how to configure specific kinds of charts and how to add a chart to a portal.
To see examples of interactive charts, add the standard WorkManager portal to your access group. Then, display that portal by selecting Open > Portal > WorkManager. The Process Dashboard in the WorkManager portal displays four interactive charts, one of which is the pie chart named Top Process Resolvers (Figure 1).
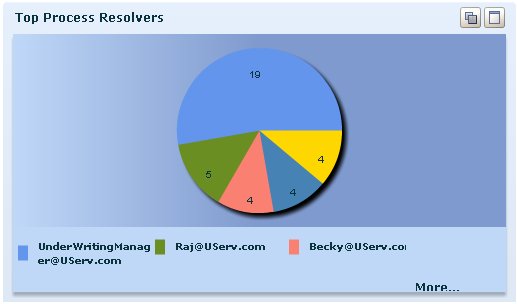
Figure 1. Example pie chart: Collision Policies by Policy Decision
Suggested Approach
Before you begin, install the Adobe Flash 9 browser plug-in so your browser can display interactive charts correctly. Additionally, print the help topic for the interactive charts window.
Install Adobe Flash Player 9
Use your browser to navigate to ![]() http://www.adobe.com/products/flashplayer/
http://www.adobe.com/products/flashplayer/
Then download (and install) the Adobe Flash Player 9 plug-in.
Print the Interactive Charts Window Help Topic
The Interactive Charts window does not yet provide access to the Application Developer help system. Therefore, before you begin, print the help topic for this window so you have it with you as a reference tool when you begin configuring charts. Complete the following steps:
- Select Help > Developer Help.
- Locate the topic named “Help: Completing the Interactive Charts window” by using the Index tab to search for the word “interactive.”
- Click the Show All widget at the top right of the topic.
- Print the topic.
How to Access the Interactive Charts Window
You configure interactive charting for your reports in the Interactive Chart window. You can open this window from one of two places:
- The Charts form in the Report Wizard
- The Charts tab of a summary view rule
To open the window, complete the following steps:
- From either the Charts form or the Charts tab, select the Use a chart for the view option.
- Click in the Select chart output type field and select Interactive(Figure 2).
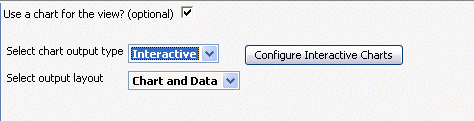
Figure 2. Selecting the Interactive Charts option
- Click Configure Interactive Charts. The window appears (Figure 3).
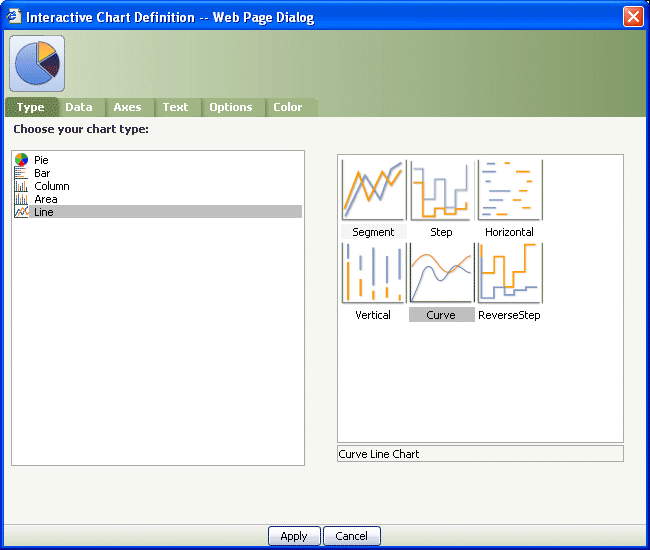
Figure 3. Selecting the Interactive Charts option
Related articles
For instructions about how to create interactive charts and then add them to your portal rules, see:
- How to create an interactive pie chart
- How to create an interactive stacked bar chart
- How to create an interactive trending line chart
- How to create an interactive trending line chart that tracks two data series
- How to add a chart to the WorkManager portal
This article links to multiple PRKB articles that are published as a group and can be read in sequence.
The PDN contains other articles about interactive charts, in addition to those in this group. Click the blue Contents for Category button or use search to access additional articles.