Use a map to illustrate a report
Pega Platform™ includes hundreds of maps you can use these maps to illustrate the data in a Report Definition, allowing report users to see graphically how data values are distributed and compare across geographic areas. Optionally, you can set up drill down maps so that, for example, users can drill down from a country view to see the same data by state or province.
Note that you can't define a map chart in the Report Editor. Developers can define map charts in the Designer Studio, using the Charts tab of a Report Definition.
The process of adding a map to a report includes these steps:
- Create the report, making sure it includes data that will display in a meaningful way when associated with regions on a map.
- Optionally create a drill-down report and associate it with the main report.
- Select the map type for the report.
- Optionally select a set of drill-down maps for the drill-down report..
- Use the Maps gadget on the Reporting > Settings landing page to associate your report's data values with the appropriate areas of the map (and any drill-down maps) you want to use.
- Add colors, conditions, font formats, and other settings to achieve a pleasing and compelling result.
We look at each of these steps in detail in the following material.
1. Create the report
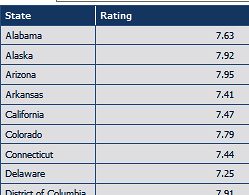
For this example, we're dealing with a simple report of ratings of our "WhatsThis" product in the United States. The data shows ratings by state, and where it's available provides ratings by county within a state.
The Report Definition has, on the Query tab, columns for state and rating, with "Rating" using a summary function:
2. Create and associate the drill-down report
In a summary report, the user can click on any row or cell to drill down to a detailed report that lists those instances or rows included in the row or cell clicked by the user. In the same way, users can click on a geographic area of a map and view a second map that shows that data broken out into more detailed geographic areas. The drill down map is included in a custom drill down report. To make this work you have to specify a custom drill-down report and then map its data to a set of drill-down maps.
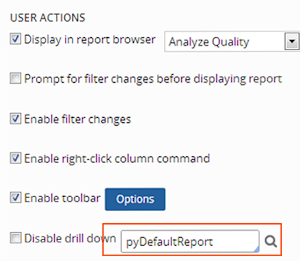
Specify a custom drill down report on the Report Viewer tab to replace pyDefaultReport:
When you run the report you can review the data and drill down to see state-by-state data for certain values:
Identifying regional patterns and comparing values across different states is not as easy in a tabular display as it is with a visual display. The solution is to display a drill-down map showing states within the US.
3. Select the map for the report
The help documentation lists the maps available on the page "Maps available for use as charts". However, the SmartPrompt feature helps you find a useful map:
- On the Chart tab, click All Chart Types and select Map as the chart option in the Chart Editor.
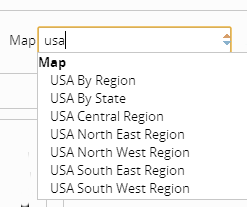
- In the "Map" field that appears, enter a few characters that might appear in the name of the map you want (in this example, "USA By State"), then click the down arrow.
- From the options that appear, select the map to use; or try a different search.
4. Select the map for the drill-down report
When providing drill-down from a map such as World by Country to another map on a drill-down report, it is not possible to know in advance which country a user may click to drill down on, and therefore which country map to use in the drill down report.
To solve this problem, Pega Platform provides a set of generic map types that refer not to a single map, but rather to a set of maps that may be used. So, when drilling down from a World by Country map, you might define a custom drill down report that uses the map type Country by State (or Province). This map type refers to a large set of maps, one for each country, in which data is shown by state or province within that country.
When you define a custom drill down report using one of these generic map types, you cannot preview the map at design time (since the specific country map to show is not known); it can only be viewed at run time.
When a user clicks a country on the World by Country map to drill down on it, the appropriate country map is substituted in the custom drill down report for the generic Country by State type, and the map for the selected country is shown.
The Chart Editor lets you choose for the drill-down report a set of regional maps (in this case, states of the United States) that have their own regions where applicable (in this case, counties).
- Select the report you specified as the custom drill-down report.
- On the rule's Chart tab, select Map for the chart type.
- In the "Map" field that appears, enter "Drill" (for "Drill Down") and click the down arrow. The system displays sets of regional maps that are available to illustrate your drill-down report:
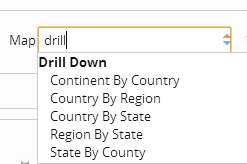
- Select the set you want, (in this case, "State By County")
5. Use the Maps gadget
You now have to associate the data in each report with regions in its map (or set of maps), so the correct data appears for each state and county.
- In the Pega Platform menu, select Reporting > Settings > Maps.
- In the "Map Type" field, identify the map for the report, as you did in the Report Definition rule form.
- In the "Class" field, select the class containing the Report Definition.
- Select an unlocked RuleSet and version in which to save the Map Value settings. Note: you should never manipulate a map value rule directly; always use this gadget in the landing page.
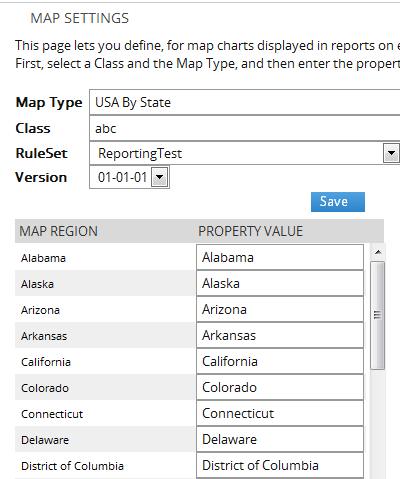
You only need to change the default mapping values that appear if you need to match the property names for the class you are working with ("MA" instead of "Massachusetts", for example). - Click Save to save the mapping.
For the state maps that illustrate the drill-down report, follow the same basic steps. For this example:
- Enter the name of a state for which you have data in the "Map Type" field.
- In the "Class" field, select the class containing the Report Definition.
- Select the RuleSet version in which to save the map values, as before.
- The gadget displays the list of counties for the state you selected. Map the properties in the report to the counties in the state:
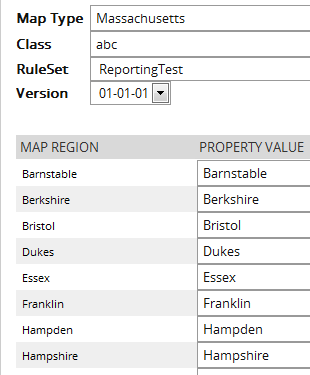
- Click Save to save the mapping.
- Repeat steps 1-4 for each state for which you have data.
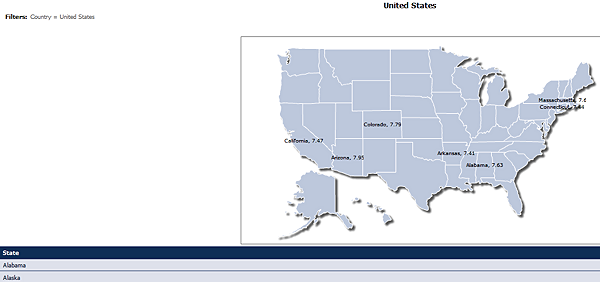
When you save your work and run the report, the map appears above the report. The states whose regions we mapped to values have their names and ratings displayed on the map; the states without a mapping do not, as the system does not know what to display:
6. Customize the map
To give the map even more impact, establish a palette of conditional colors. If a state's rating meets one of the conditions, the map uses that condition's color for that state.
- On the Chart tab for the Report Definition, select Color Settings and then Conditional Colors.
- In the form that appears, add conditional colors for property conditions significant to your project or your audience. In this example, the highest-rated states use a green color, and the lowest-rated states use red:
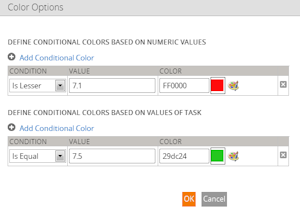
Now when we run the report, we see the states highlighted for good and poor performance:
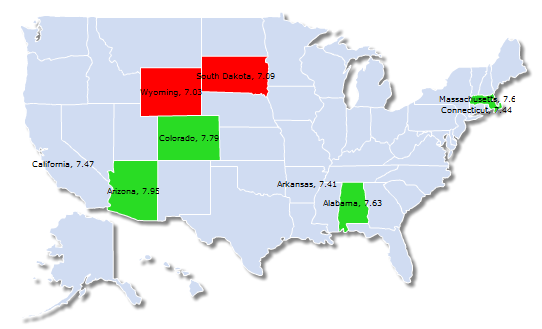
Note that the names and ratings for California, Arkansas, and Connecticut appear on the map, because values have been mapped to those map areas, but they do not get a special color because their ratings are neither below 7.1 or above 7.5.
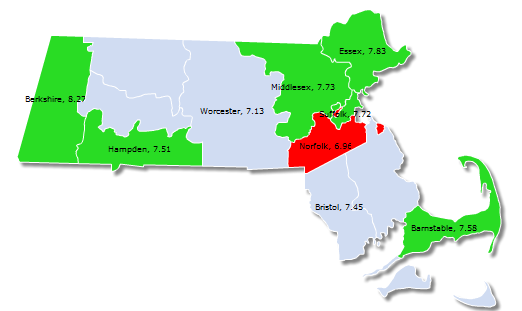
If we apply the same conditional colors to the drill-down report (dState), the user can drill down and get a better sense of what is happening in a selected state:
For general information about charts, see Working with charts in reports (Pega 7).