How to display process statistics using flow overlays in Process Modeler
Summary
Process throughput statistics can help managers identify issues such as assignment delays or heavily-used flow action paths that may negatively affect overall flow performance.
You can display these statistics in Process Modeler by using flow overlays on the Diagram tab of your flow rule form. There are five types of overlays: Task Volumes, Flow Analysis, Task Duration, Policy Overrides, and Optimization. You can drill down into reports containing the items that comprise the statistics. This article shows you how you display the overlays and describes the information they contain.
Note: The Overlay drop-down menu does not appear on the toolbar for screen flows or on the Discovery Map.
Suggested Approach
To use flow overlays, open a flow rule form. On the Diagram tab, click the Overlay drop-down list to display available overlays. The default is None.

You can select the following overlays:
- Task Volumes — Hover over the overlays icon (
 ) on an assignment to display the current volume of work item assignments for each step in the process. The overlay displays a count of work items on the assignment that are on time, past goal, and past deadline.
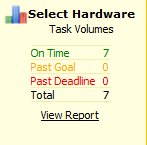
Click the View Report link to open a list view of the work items currently at this assignment. You can also access the Timeliness by Task summary report from the Analyze Performance group of reports. The report includes a graphical representation of the data for all the assignments in the flow.
Flow Analysis — Hover over the overlays icon (
) on an assignment to display the statistics describing the flow-action path that work items have taken at each assignment. The percentages displayed represent the actual usage patterns in the system and may be used to benchmark and update the design-time percentages that are defined when editing the flow.Flow actions that appear in light gray text, such as ActionStubDraftMode in this example, previously had work routed through them, but they are no longer associated with the assignment. They are included in the percentage calculations for accuracy in the report.
Click View Report link to open a summary view of the items comprising each action. You can open a summary view for all the assignments in the flow by clicking Flow Analysis in the Design tab.
- Task Duration — Hover over the overlays icon () to display the total cases and average time that an operator takes to process each of the assignments in a flow. The duration is displayed in the HH:MM:SS format.
Click View Report link to open a summary view of the items comprising each assignment. Drill down further by clicking the assignment to view a list of individual work items. You can access the Average Duration per flow task summary report from the Analyze Performance group. The report includes a graphical representation of the data for all the assignments in the flow.
- Policy Overrides - The Policy Override feature supports the design of rules for detection, tracking, and disposition of unusual circumstances in work item processing. Select this option to identify those local or flow actions that are linked to a declarative OnChange rule that may suspend execution of this flow. Each such action is marked with an override icon (
 ). Hover over the icon to display the overlay. The Override property and the Override (Declare OnChange) rule appear.
- Task Volumes — Hover over the overlays icon (
- Optimization - Use Optimization to perform probability analysis on assignments with multiple flow actions to identify common flow patterns and trends. Using a set of resolved data in a specified date range, identify work item properties you would like to analyze for assignments. Data is sorted into subsets according to flow actions to discover a historical flow pattern that you can save in decision trees or decision tables to use in your flow. You can use resulting data to automate, reconfigure, or eliminate steps.
Additional Information
About Standard Management Reports (Monitor Activity Reports)