Sample Robotic Automation solution: HTML grid to Excel
This sample solution shows how to loop through the contents of an HTML grid and copy the data to an Excel spreadsheet by using Pega Robot Studio.
Project items
- Web application: AKPoker
- StartPage: http://training.openspan.com/rankings.html
- Internet Explorer version 8 was used
- The page is minimized after the data is read from the table.
- Windows form: Windows form
- Microsoft Office Excel 2013 was used
- Workbook: C:\Program Files\OpenSpan\OpenSpan Studio\How To AKPoker Table\AKPoker Table.xlsx
- Change the path to the location that you specified for this file
- Automation: Add Row
- Automation: Copy Table
- Automation: Globals
- Automation: Set Headings
Automation details
Add Row
This automation writes to the Excel spreadsheet: C:\Program Files\OpenSpan\OpenSpan Studio\How To AKPoker Table\AKPoker Table.xls the path that is specified in the Windows form. It uses the Excel connector.
The Add Row automation is called from the Copy Table automation after a particular player row is identified by using the ForLoop process. This process yields indices that are passed to the Add Row automation by way of an entry point and are used to pull data from specific cells within the HTML grid. For example, when the dataCell_Name.Text property is placed on the automation, the parameter is selected to identify the contents. The Index parameters display, and indices for the league, division, and player are supplied to identify the cell.
Before the data can be written to an Excel cell, the cell must be identified by row and column. The Counter supplies the row number. For the player name, the A column of the spreadsheet is used. The StringUtils Concat method is used to create the result Arownum, where rownum is the value of the counter. This result is provided to the Excel component’s SetCellValue method, which requires the cell to be identified by row and column, such as A20 for column A, row 20. This process is repeated for the other HTML data cells to be copied to the Excel spreadsheet.
After all data for a particular player has been copied, the counter is incremented so the next player record begins on a new row.
The final part of the automation is to calculate a running tally of the players’ earnings. This is accomplished by using the Excel SUM function. By setting a cell to the formula and then retrieving the contents of the cell, the sum of the earnings column can be retrieved. A StringUtils component, Format method, is used to format the SUM function as required. To determine the entire range of rows to include in the formula, the VarPlayersTotal variable is used from the Globals automation.
Copy Table
This automation reads each row of data from the HTML grid and then launches the Copy Table automation to copy the data to the Excel spreadsheet.
To read a row of player data, the automation must read each player row in a given division and league. When it finishes reading the divisions in a league, it repeats the process with the next league. This process requires three ForLoop components. The first ForLoop processes the leagues, the second ForLoop processes the divisions, and the third ForLoop processes the players.
The limit for each ForLoop is set by the Count property for the table section. Note that the Count property is for the table element above it in the table schema hierarchy. For example, to get the number of divisions, highlight the League table section.
By the end of this automation, indices are set for the league, division, and player. These indices are used to pull a particular cell value into the Add Row automation. These indices are passed to the Add Row automation via the Execute method.
Set Headings
This automation contains the Counter component that is used in the Add Row automation. The Counter is set at two (2), which is the first blank row in the Excel spreadsheet. After the initial value, the Add Row automation increments the value to set the new row value for writing data.
This automation also contains the VarPlayersTotal variable, which is the total count of players in the table (Player.AbsoluteCount) plus one and sets the row numbers that contain player data in the Excel spreadsheet. This variable is used in calculating the sum of the player earnings.
This automation sets the headings to be used in the Excel spreadsheet. The matching cells for the Name, Wins, Losses, and Earnings are copied from the HTML grid to the spreadsheet by using the SetCellValue method for the Excel component.
Special considerations
When interrogating the Rankings.html page, keep in mind that this page contains multiple repeating sections, as displayed in the following image:
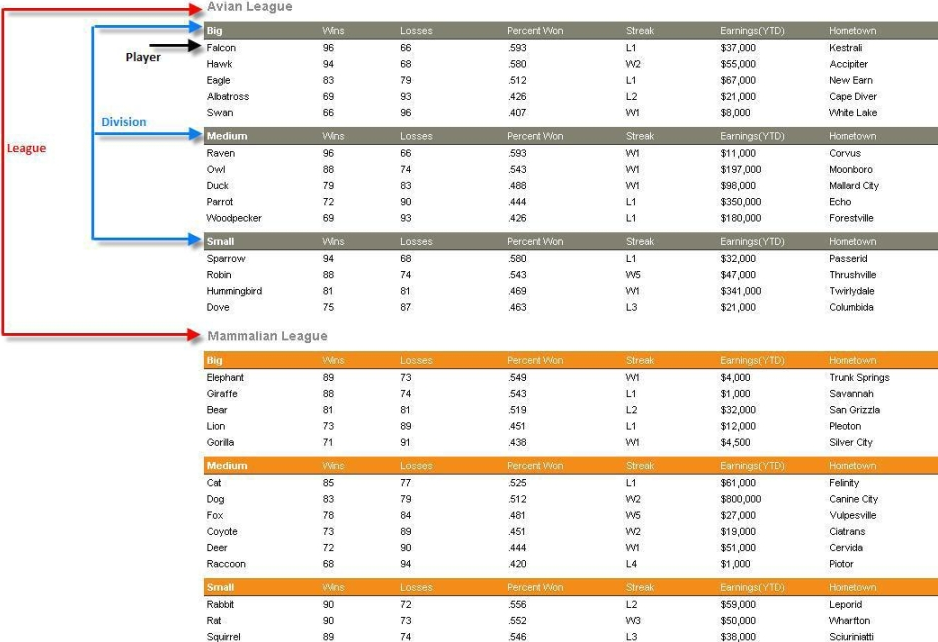
Start by interrogating the entire table by using the HTML Table Designer option. After the table opens in the HTML Table Designer, to create the table sections, complete the following steps:
- Highlight rows: Avian League up to, but not including, Mamalian League and select it as a table section. Assign this name to it: League.
- Mark the Avian League row as a data cell.
- Mark the Big cell as a data cell. Mark the rest of the cells on that row as matching cells.
- Highlight the first set of rows from Big up to but not including Medium as a table section. Assign this name to it: Div.
- Highlight the first row of player data and mark the cells as data cells. Also, set this row as a table section. Assign this name to it: Player.
- Name the matching cells and data cells. For this sample solution, the cell contents are appended to the cell name, for example, MatchCell_Wins.
- Apply the changes to the Player table section.
- Apply the changes to the Div table section.
- Apply the changes to the League table section. Your table schema should resemble the following image:
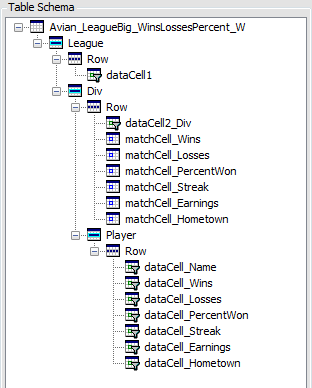
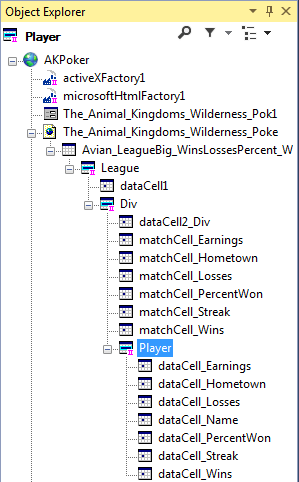
- Save the table design and exit the HTML Table Designer. Your Object Explorer should resemble the following image:
You can download completed solutions for each version in the following table:
| Studio version | Built by using this build | Sample solution download |
|---|---|---|
| 8.0 | 8.0.1037 | HTMLGrid to Excel 8.0 |
| 8.0.SP1 | 8.0.2037 | HTMLGrid to Excel 8.0 SP1 |
| 19.1 | 19.1.2.0 | HTMLGrid to Excel 19.1 |
Previous topic Sample Robotic Automation solution: File access Next topic Sample Robotic Automation solution: HTML table click