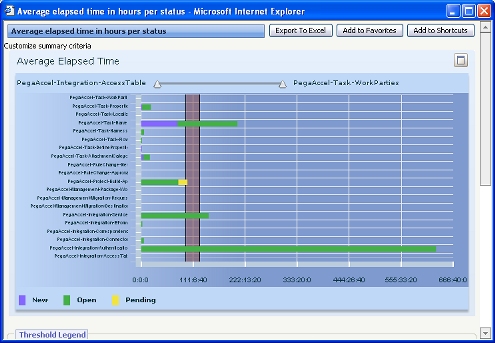
A bar chart presents values as horizontal bars. For example, the standard summary view rule Work-.PipelineCompletedByClass shows, for each work type, the average elapsed time in work object status values starting with New, Open, or Pending.
To view this chart for your own application:

To create an interactive bar chart:
Interactive as the Chart
Output Type.Bar type.For an example, see Pega Developer Network article ![]() PRKB-24154 How to create an interactive stacked bar
chart.
PRKB-24154 How to create an interactive stacked bar
chart.
| interactive chart, slider | |
|
|
About Summary View rules |