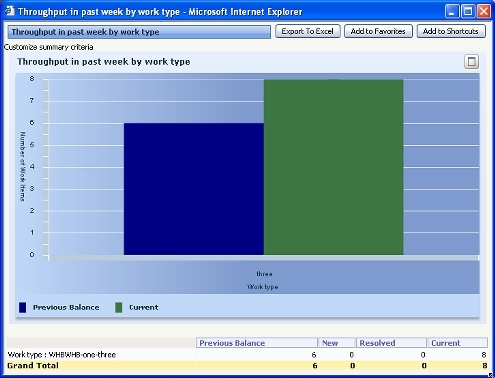
A column chart presents values as vertical bars. For example, the standard summary view rule Work-.WeeklyThroughputIC shows the number of work objects resolved during the past week as a column chart.
To view this chart for your application:
To create an interactive column chart:
Interactive as the Chart
Output Type.Column type.| interactive chart, slider | |
|
|
About Summary View rules |