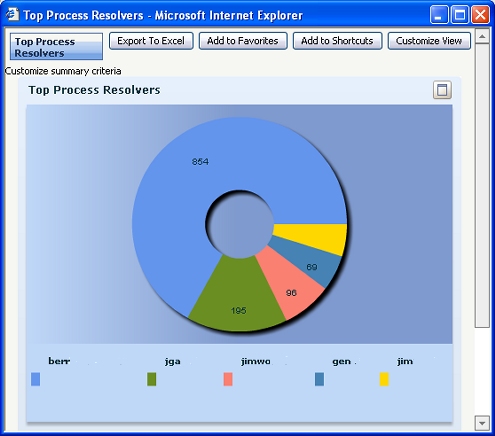
A pie chart presents values as set of pie slices, adding to 100%. For example, the standard summary view rule Work-.CountResolvedByResolverTop5IC presents pie slices for the five operators in a work group who resolved the most work objects, as shown in the following example image.
To view this chart for your own application:
To create an interactive pie chart:
Interactive as the Chart
Output Type.Pie type and a subtype,
such as Donut or Exploded.For an example, see Pega Developer Network article
![]() PRKB-24154 How to create an interactive pie
chart.
PRKB-24154 How to create an interactive pie
chart.
| interactive chart, slider | |
|
|
About Summary View rules |