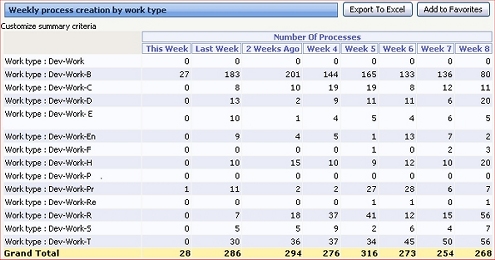
A trend report presents counts of events that
occurred at a past moment in time, as recorded in one or more
Single Value properties that has a
DateTime type.
For example, the standard summary view rule Work-.ArrivalsPastEightWeeks presents counts of the number of new work objects created (by work type) in each of the immediate past eight calendar weeks.
To view this chart for your own application:

To create a trend report:
DateTime properties that are
the basis of the time intervals.DateTime property, the dates and times for each
range, and the labels. See
Summary View form — Completing the Content tab —
Entering trend details.You can present values in a trend report as an interactive line chart:
Interactive as the Chart
Output Type.Line type.For example, open and run the
Work-.ArrivalsPastEightWeeksIC summary view rule.
For another example, see Pega Developer Network article
![]() PRKB-24156 How to create an interactive trending line
chart.
PRKB-24156 How to create an interactive trending line
chart.
| interactive chart, slider | |
|
|
About Summary View rules |