
 Trend
report
Trend
report
Trend
report
Trend
reportA trend report presents counts of events, objects, or actors at a series of points along a continuum, normally a time line. The X-axis of a trend report displays data points on that continuum representing weeks, months, or quarters in a year, or some other meaningful increment. One column of the data supporting the trend report is displays one or more Single Value
properties of a DateTime type.
In a report definition rule, create a summary-type report, one including at least one column of summarized data. One of the columns holds the continuum value that provides the X-axis of the report and any accompanying chart. To set the function summarizing the data by some unit of time, click the Function Builder icon (![]() ) to the right of the column to display the SQL Function Builder. Select the time-related function that suits your report. See Report Definition rules — Completing the Design tab.
) to the right of the column to display the SQL Function Builder. Select the time-related function that suits your report. See Report Definition rules — Completing the Design tab.
![]() If you add a chart to the report, note that
If you add a chart to the report, note that
See Report Definition rules — Defining and editing charts.
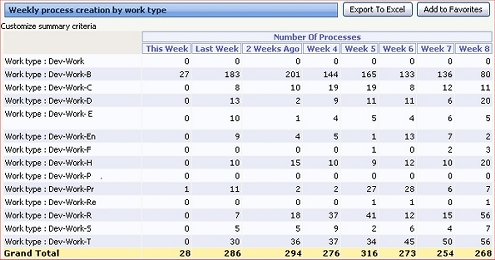
The standard summary view rule Work-.ArrivalsPastEightWeeks presents counts of the number of new work objects created (by work type) in each of the immediate past eight weeks.
To view this chart for your own application:
To create a trend report:
DateTime properties that are the basis
of the time intervals.DateTime
property, the dates and times for each range, and the labels. See
Summary
View form — Completing the Content tab — Entering trend
details.You can present values in a trend report as an interactive line chart:
Interactive as the Chart Output
Type.Line type.For example, open and run the
Work-.ArrivalsPastEightWeeksIC summary view rule. For
another example, see Pega Developer Network article ![]() PRKB-24156 How
to create an interactive trending line chart.
PRKB-24156 How
to create an interactive trending line chart.

|
interactive chart, slider |

|
About Report Definition rules
About Summary View rules |
|
|
Atlas — Standard SQL Function Alias rules |
 Definitions —
T
Definitions —
T