|

 Tracer
After you choose a connection and set Tracer options, the Tracer records selected events from the rule executions, database operations, and other event types you selected.
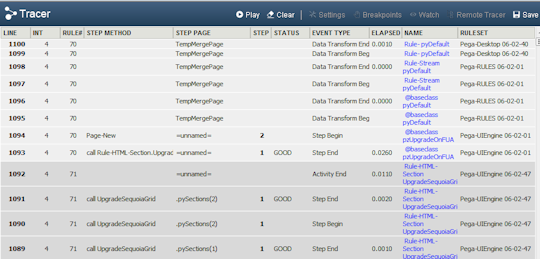
Rows of the Tracer results display
The Tracer adds a row for each of the Events To Trace that you selected in your Trace Options and for rules executing in the selected RuleSets.
Each row has a color-coded background:
- Gray — activity processing.
- Orange — events from flow, decision, or declarative rules (if selected in the Trace Options panel.)
- Light blue — PegaRULES database and cache operations
![]() The value of some columns in the Tracer results display change depending on the type of traced event. When applicable, a change in value for a column is noted in the table below.
The value of some columns in the Tracer results display change depending on the type of traced event. When applicable, a change in value for a column is noted in the table below.
Column |
Description |
| Line |
Number of events traced, starting at 1 for the first (oldest). |
| Rule # |
Count of distinct activities traced. This is not reset to zero if you clear all the events. When a single activity is re-executed later, the previously assigned number is repeated. Rules other than activities are not assigned a number. |
| Step Method |
For an activity, the method in this step. For a declarative rule or decision rule, indicates the start or end of a computation. For a when condition rule or Boolean expression, identifies the rule name or (a portion of) the expression.
|
| Step Page |
Name of the step page, or
|
| Step |
Step number of this step. When two or more rows appear with the same step number, an iteration is in process at that step. |
| Step Status |
Status of the method in the step, from the pxMethodStatus property, such as
|
| Watch |
(Optional column.) Properties that you've used the Watch Variable facility to watch. |
| Event Type |
Type of event or rule: |
| Elapsed |
For |
| Name |
Full name of the rule being traced as a blue-text link, showing all key parts.
|
| RuleSet |
RuleSet and Version containing the rule being traced. |
Interacting with Tracer results
This window supports five types of interactions:
- Click within the blue text in the Name field on any row to open the corresponding rule instance in your portal workspace.
- Click the Line, Rule # or Step fields to learn more about the event that caused the row to be displayed, including a Java stack trace if an exception occurred.
- Click the Step Page value in a row to review properties on the step page as of the time this step began.
- From the Line display, click the blue ParameterPageName link to see the contents of the parameter page.
- From the Line display, click the blue PrimaryPageName link to see the contents of the primary page.
A blue arrow marks the row of your most recent interaction.
 Using the Tracer