|
After you choose a connection and set Tracer options, the Tracer records selected events from the rule executions, database operations, and other event types you selected.
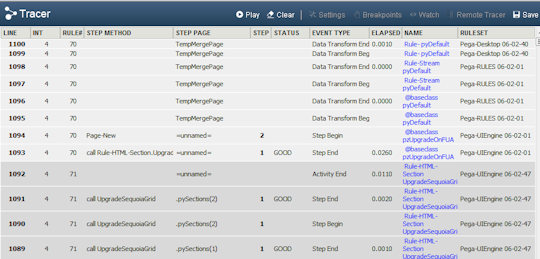
The Tracer adds a row for each of the Events To Trace that you selected in your Trace Options and for rules executing in the selected RuleSets.
Each row has a color-coded background:
![]() The value of some columns in the Tracer results display change depending on the type of traced event. When applicable, a change in value for a column is noted in the table below.
The value of some columns in the Tracer results display change depending on the type of traced event. When applicable, a change in value for a column is noted in the table below.
Column |
Description |
| Line |
Number of events traced, starting at 1 for the first (oldest). |
| Rule # |
Count of distinct activities traced. This is not reset to zero if you clear all the events. When a single activity is re-executed later, the previously assigned number is repeated. Rules other than activities are not assigned a number. |
| Step Method |
For an activity, the method in this step. For a declarative rule or decision rule, indicates the start or end of a computation. For a when condition rule or Boolean expression, identifies the rule name or (a portion of) the expression.
|
| Step Page |
Name of the step page, or
|
| Step |
Step number of this step. When two or more rows appear with the same step number, an iteration is in process at that step. |
| Step Status |
Status of the method in the step, from the pxMethodStatus property, such as C-428
|
| Watch |
(Optional column.) Properties that you've used the Watch Variable facility to watch. |
| Event Type |
Type of event or rule: |
| Elapsed |
For |
| Name |
Full name of the rule being traced as a blue-text link, showing all key parts. REVISED 5.4
|
| RuleSet |
RuleSet and Version containing the rule being traced. 5.4 Proj-1318 |
This window supports five types of interactions:
A blue arrow marks the row of your most recent interaction.

 Tracer
 Using the Tracer