
 Line
chart
Line
chart
Line
chart
Line
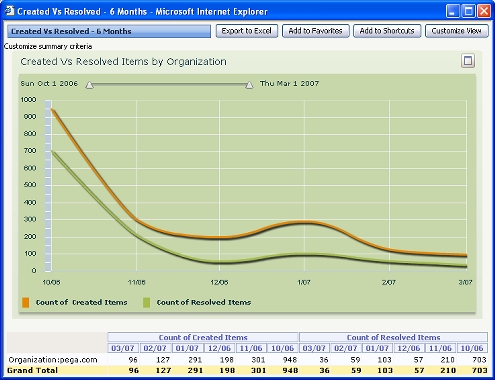
chartA pie chart presents values as a series of sloped lines, or as a smooth curve. For example, the standard summary view rule Work-.ICcreatedResolved6m presents two lines, one for the number of work objects created during a period, and one for the number resolved during the period.
To view this chart for your own application:
To create an interactive line chart:
Interactive as the Chart Output
Type.Line type and a subtype.For an example, see Pega Developer Network article ![]() PRKB-24156 How
to create an interactive trending line chart.
PRKB-24156 How
to create an interactive trending line chart.

|
interactive chart, slider, trend report |

|
About Summary
View rules
About Report Definition rules |
 Definitions —
L
Definitions —
L