|
 Access
Category |
Page |
|
|
 Visual Business Director Visual Business Director |
Visual Business Director (VBD) allows you to perform historical analysis. It enables business users to visualize the business based on different views (proposition, channel, customer, etc.) and examine the success levels down to any level. Through the VDB applet, the landing page provides the facilities to visualize decision results and monitor business metrics with a 3D graphical view of the different dimensions and measurements, such as accept and conversion rate, average price, volume, number accepted and number of processed responses.
The Visual Business Director landing page contains a single tab, the Planning tab.
This landing page is available to users who have access to the Decision Strategy Manager application. For additional information, see the PDN article ![]() About the Decision Strategy Manager.
About the Decision Strategy Manager.
The Planning tab displays the visual results and views of decisions in a variety of graphical views. The display features controls, menus, filters and chart types that integrate and manipulate a total view of the business.
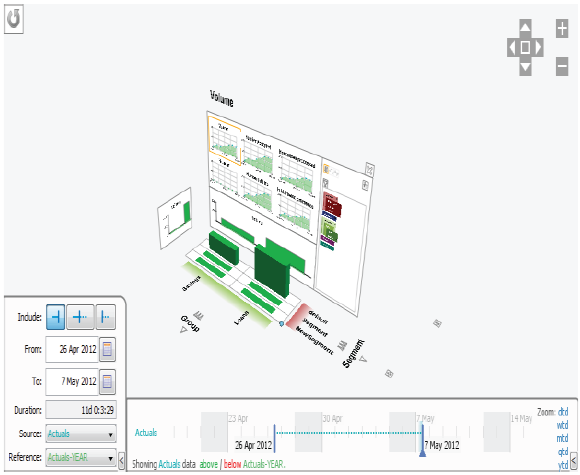
- The button on the top left corner of the VBD applet refreshes the data.
- On the top right corner, buttons are available for zooming in/out, changing the orientation of the VBD applet, and setting it to default view.

- The context menu allows you to capture the current state of the VBD applet to clipboard or file, export grid data, save a view, and load a predefined view.

- Bar charts on the VBD applet walls show the calculation for a single dimension and the target values.
- Each line chart shows a different metric over the current time period selected in the timeline. Clicking a chart makes the grid use that metric.
- Bars show the performance for a combination of two dimensions. Color saturation is applied based on quantity below/above target, and each bar provides a view of the statistics.
- The VBD applet supports changing the dimensions displayed in the X (right) Y (left) axis, using different data modes, displaying multiple grids, filtering on different dimensions, and exporting grid data.
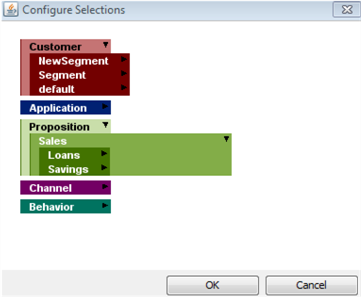
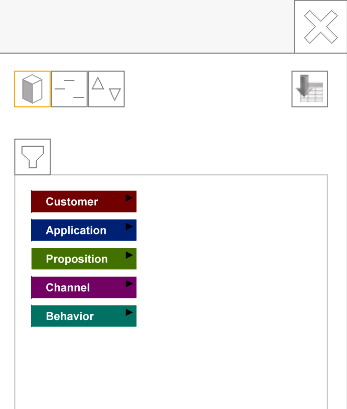
The dimension filter allows you to dynamically define customer interactions using multiple dimensions. The filter works as a slider displaying the hierarchy of the different dimensions. The tree view shows the different levels up to the selected item. Use single (left) click selection to select/deselect levels. If the item is already part of the defined filter settings, it will be deselected. Each dimension is displayed in a different color. The color saturation shows the proportion of selected items in the dimension's hierarchy. When nothing is selected, the item in the tree displays with white background.
The top part of the panel on the far right of the back wall of the VBD applet provides the facilities for setting different data modes. The VBD applet can operate in regular, reference data, or delta mode.
|
|
The regular mode shows the source versus reference data sources. Switch to this data mode by clicking the The reference mode shows the interaction history records corresponding to the time period selected in the Reference drop down. Switch to this data mode by clicking the The delta mode provides the comparison between the Reference and Source data sources, allow you to analyze their relative effects. Switch to this data mode by clicking the |
The timeline is the interface allowing for browsing recorded historical performance and predicted future performance. This interface consists of timeline console and timeline display. The  and
and  buttons allow you to hide/show the display and the console.
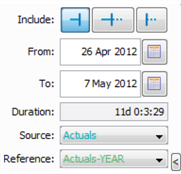
The console allows you to select the date settings for displaying data in the VBD applet and the data sources.
Section |
Description |
| From |
Selects the start date for showing the data. The earliest date that can be displayed is determined by the Start Date of Reference Data setting in the Services landing page. |
| To |
Selects the end date for showing the data. |
| Duration |
Displays the duration between start and end date. Duration is displayed in days, hours, minutes, and seconds. |
| Source |
Drop down for selecting which data source to use as source. Unless the VBD database has been configured otherwise, the Source drop down displays the following options:
|
| Reference |
Drop down for selecting which data source to use as reference. Unless the VBD database has been configured otherwise, the Reference drop down displays the following options:
|
The selected historical data views are listed on the left side. Each data view has the corresponding line showing when data is available.

Two time sliders allow you to change the start and end date. The recommended method for changing the time span is by using the From/To selection in the timeline console, but you can also change it by dragging the vertical sliders, or using the scroll buttons. When doing this, the timeline console reflects the changes.
VBD supports the ability to make future projections based on simulation data generated from existing data (forecasting) through two types of batch output configurations. In order to use this function, the customer sample used in forecasting must be based on customer data. Also, this data needs to provide a table /view with the case ID column.
By default, the Y axis in the VBD applet is set to proposition group, and the X axis to customer sub segment. You can change this by double-clicking the selected level, and using the set axis dialog to select a different dimension, or level within the dimension. The VBD applet reflects the changes when you confirm the new dimension/level selection in the set axis dialog. For example, you can perform time based analysis for behavior by setting the Y axis to behavior, and setting the X Axis to the time period you are interested in seeing customer behavior for.
Set Y Axis Dialog
- Double-click the axis label on the left. By default, it displays the Group.
- Use the Set Y Axis dialog to change it to show Behavior.
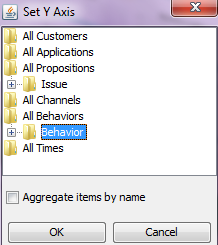
- Click OK.
Set X Axis Dialog
- Double-click the axis label on the right. By default, it displays Sub Segment.
- Use the Set X Axis dialog to change it to show Day.
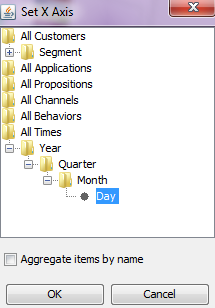
- Click OK.
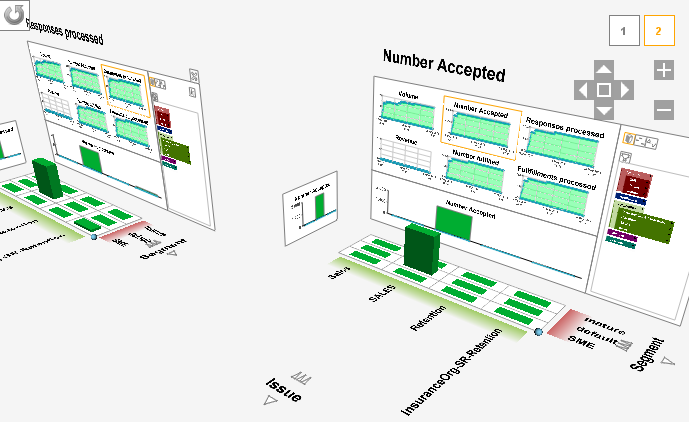
You can add multiple grids in the VBD applet, allowing you to focus on different aspects of the business strategy. Enabling multiple grids is done by using the + icon at the far right of the X axis. After adding multiple grids, you can define filters for each individual grid using the facilities provided in the back wall. You can remove a grid by clicking the close button on the top right corner of the back wall. The timeline selection remains common to all grids. If the + button is not visible, click the control (zoom out) until the + button is visible in the grid. In the example below, two grids are added to compare the number of responses processed versus number of positive responses.
You can export grid data by using the  icon in the right side of the VBD applet's back wall. You need to provide a name for the CSV file, select the location on disk for this file and save the file. This file can be used for offline analysis using a suitable tool, such as Microsoft Excel.

|
landing page |

|
About predictive analytics and Decision Strategy Manager
|


 Decisioning
 Planning tab
 icon.
icon. icon.
icon. icon.
icon. Designer Studio basics
 Help Home