 Bubble chart
A bubble chart presents three dimensions of data in a two-dimensional format.
Points appear within horizontal and vertical axes to represent two of the three dimensions. A colored circle or bubble presents the third dimension.
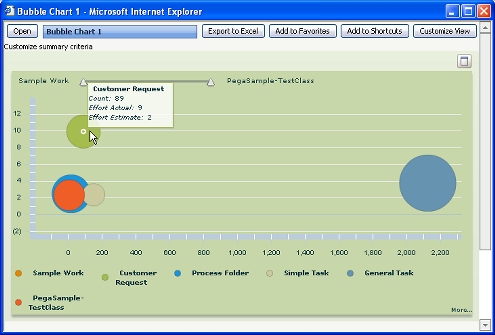
For example, the following chart contains one color-coded bubble for each of the six work types in a work pool; one bubble is obscured.
- The vertical axis presents the sum of the pyEffortActual values for the work items.
- The horizontal axis presents the count of open work items of that type.
- The size of each bubble indicates the sum of pyEffortEstimate values for the work items.
Hold the mouse pointer over any bubble to view the data values.

To create an interactive bubble chart:
- Design and test a summary view report with three rows in the Fields array on the Content tab.
- On the Chart tab, select Use a Chart for the view?
- Select
Interactiveas the Chart Output Type. - Click Configure Interactive Chart. Select the
Bubbletype.

|
interactive chart, slider |

|
About Summary View rules |
 Definitions — B