 Threshold
Summary View rules
A threshold on a summary view report is a colored background that appears behind rows of a report (or behind values in an interactive chart) to mark a meaningful range.
For example, a work group manager may consider:
- 99 or fewer resolved work items in a full workday day as poor or subpar
- 100 to 199 as typical or par
- 200 or more as excellent
Thresholds can record the manager's assessment.
Although optional, thresholds in a report or chart can help a manager quickly identify which business results fall within, or outside, targeted ranges.
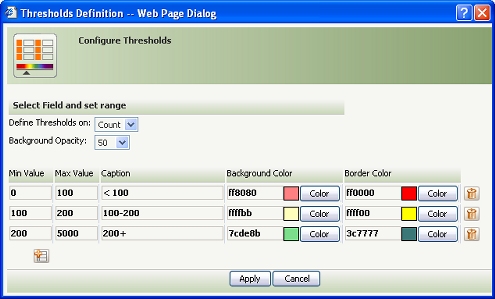
Define thresholds on the Contents tab of the Summary View form. This example defines three thresholds, with values 0 to 100 colored red, 100 to 200 colored yellow, and values above 200 colored green.

Alerts
Certain alerts occur when a time interval, or number of bytes, exceeds a threshold limit. For example, the interactionTimeThreshold is a time interval in milliseconds, with a default value of 500. The system adds a line to the Alert log when server response time to an interactive browser user exceeds this threshold.
You can set a higher or lower value for this and other thresholds in the prconfig.xml file or with Dynamic System Settings.

|
Alert log, prconfig.xml file |

|
About Summary View rules Understanding alerts |
 Definitions — T