|

|
Introduction
The Home display for the Business Analyst portal presents information about the current application. The page contains these tabs:
Some fields in the tabs reference rules or reports. When an underline appears under a name as the cursor rolls over it, you can select that name to open the underlying rule form or report.
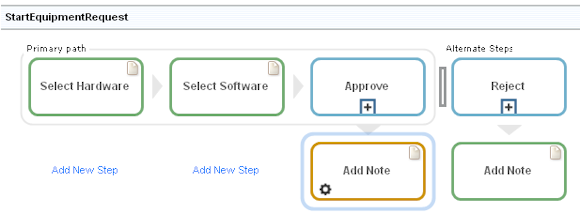
Use this tab to work with the application's processes in the Discovery Map view. The Discovery Map view provides an interactive top-level view of business process steps in a process.

This tab displays the Discovery Map view of the process associated with the selections in the Work type and Starting process fields. If there are no work types defined for the current application, this tab displays a message with appropriate actions to take to enable work types in the application.
To view and work with a process on the Discovery Map tab, first select a work type and then one of the processes in the Starting process field.
Field |
Description |
| Work type |
Click to select a work type.
|
| Starting process |
Click to select a process. The Discovery Map view of that process is displayed. The processes that are available to select are those processes which:
|
| Displayed process |
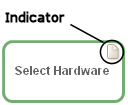
Each displayed shape represents a step in the business process. An icon on a shape indicates the shape has an associated specification. Double-click a shape to view, and optionally update, information about that step, such as its specification information and its associated technical properties (if any). Note: You can update the specification information only if the specification belongs to an unlocked RuleSet. See Editing processes with the Discovery Map view for information about working with the shapes. |
| Save |
Click to save any changes you make in the Discovery Map tab. The system updates the appropriate underlying rules that correspond to the changes. |
| Save and Run |
Click to save any changes you make in the Discovery Map tab, and then run the updated process. The system updates the appropriate underlying rules that correspond to the changes, and then runs the process. |
See the ![]() PDN article Creating Discovery Maps and others listed in the Inception section of the Business Analyst Resources area of the PDN.
PDN article Creating Discovery Maps and others listed in the Inception section of the Business Analyst Resources area of the PDN.
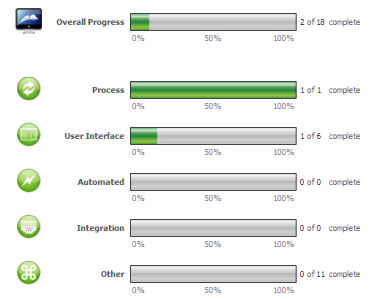
This tab reflects the progress made to date on development of the current application.

Progress is displayed for the completion status of the specifications in five categories, as well as overall progress for the application.
To drill-down to details about the specifications in a particular category, select one of the numbers at the right of the progress bar for that category.
Use the Specification Explorer tab to work with the current application's case (work) types, supporting types, specifications, and their associated requirements. The specifications are displayed in a tree hierarchy, organized by case (work) type and supporting type.
Usually this information is initially collected in an application profile using the Application Profiler, and generated in the system by the Application Accelerator, or entered into the system using the Specifications tab on the Case Designer landing page.
Field |
Description |
|
Case Types & Specifications |
Tree hierarchy of the application's case (work) types, supporting types, and their specifications. Supporting types and their specifications support the operation of the application and processing of case types but do not create work items, do not have a status, and cannot be routed to actors. If the RuleSet version for a specification is unlocked, you can double-click it to edit its details. The Edit Specification window opens and you can update the specification information and associate requirements with this specification. If the RuleSet version is locked and you double-click an item, a read-only window opens where you can view information about the item. |
|
Short Description |
For case (work) types and supporting types — A brief description of the item. For specifications — A brief description of the steps involved in completing the specification. |
|
Type |
Indicates whether the row contains a case (work) type, supporting type, or specification. |
To add a specification to a particular item, right-click the item in the tree and select Add Specification from the context menu.
To open the underlying rule for a case (work) type or specification, right-click the item and select Open Rule.
If the current application has no work types specified on the Details tab of its Application rule form, four additional actions are displayed:
Field |
Description |
|
|
Click to use the Application Profiler to add work types to the application. The Application Profiler starts. |
|
|
Click to open the Profiles in Progress list and select an existing application profile, with which you want to add new work types to this application. |
|
|
Click to add available work types to the current application. The system populates the list using the work types available in the system to choose for this application, and refreshes the display of the Case Types & Specifications tab. The system also updates the Details tab of the application rule with the work type information. |
|
|
Click to use the Application Accelerator to add new work types to the current application. |
Use this tab to assess the current application's adherence to good design and implementation best practices (such as those codified in the guardrails).
The reports provided here give the results of several checks on the rules in the application. These checks are the same as those provided by the Guardrails landing page's Summary tab. Whereas a lead application developer might do a guardrails compliance check at a single point in time to check that a preproduction application is ready for production, a business analyst typically uses the Business Analyst portal's Guardrails tab periodically to assess how well the application is doing over time with respect to meeting good design and other guardrail criteria.
For information about the checks and reports available here, see the information about the Summary tab on the Application Guardrails landing page.
When the current application and your access group are enabled to use the Key Performance Indicators (KPI) Framework, use this tab to work with and view business KPIs for the application.
![]() If the KPI Framework is not installed or if the current application is not enabled to use the KPI Framework RuleSets, a message is displayed. This message includes a link to an article at the Pega Developers Network that describes how to install the KPI Framework and configure the necessary items.
If the KPI Framework is not installed or if the current application is not enabled to use the KPI Framework RuleSets, a message is displayed. This message includes a link to an article at the Pega Developers Network that describes how to install the KPI Framework and configure the necessary items.
Elements of the KPIs tab
This image illustrates the KPIs tab with three KPIs listed: 
For each defined KPI, this tab displays:
Field |
Description |
| Name | Name of the KPI. |
| Description | Description of the KPI. |
| Applies to | The user or work group this KPI monitors. |
| Evaluation | The evaluation criteria for the KPI. |
| Last run | If the KPI is scheduled to run periodically, this column displays the date and time the last time the KPI ran. |
| Actions | Actions that can be performed on this KPI. |
You can:
- Display KPIs that are already defined for this application by selecting one of the options in the Show KPIs drop-down list.
- Create a new KPI to measure and track by clicking New.
- Work with existing KPIs using the actions available in the Actions column.
If the Show KPIs field displays User has no KPI-Gadget-MyKPI privileges, your Operator ID's access group is missing a KPI access role. Update your access group to add the KPI:SysAdmin access role, and then log out and log back in to see the changes.
Working with existing KPIs
For an existing KPI, you can:
Action |
Description |
Icon |
| View KPI results from scheduled runs | Click to view the KPI results collected to date. Available for KPIs that are scheduled to run on a periodic basis. |

|
| Preview KPI | Click to present an ad-hoc evaluation based on past work item data. Available for KPIs whose definitions allow ad-hoc evaluation. |

|
| Show historical trend | Click to display trend reports for this KPI. Available for KPIs whose definitions specified trend report creation. |

|
| Modify KPI definition | Click to modify the definition for this KPI |

|
The What's Happening tab displays the current development activity occurring in the application. In a team environment, you can use this display to monitor team members' work and progress in near real time.
The What's Happening display in the Business Analyst portal has the same behavior as it does in the Designer Studio. See Designer Studio — Working with the What's Happening display for details on actions you can take in this display.
|
|
case type, Discovery Map, key performance indicator, specification, work type |

|
Business Analyst portal — About landing pages
Application Guardrails landing page |


 Discovery Map
 Open an existing application profile
 Add missing work types to this application
 Build a new application
 Business Analyst portal basics